News in TARGIT 2021
The TARGIT 2021 version includes a range of new features, bug fixes, and general performance improvements across the product.
The new features include:
- TARGIT Insights. Gain insight into how your TARGIT solution is being used - or not being used - and increase the value of your TARGIT investment.
- New Map Offering. Previous map object types are now consolidated into one map object type. Support for Longitude/Latitude, Heat maps and automatic updating.
- Dynamic/Static periods criteria. End-users can now select either Dynamic or Static when working with time dimensions from the criteria bar.
- Dynamic Hours and Minutes. Enables dynamic time criteria such as 'Previous 48 hours' or 'Last 30 minutes'.
- Hide objects. Totally hide an object 'If empty result' or if not met by required criteria.
- Disable Object Interaction. Prevent an end-user from interacting with an object - e.g. disable drills, disable switch to data views, disable exports etc.
- Label, Shape and Image objects. Simple objects that, apart from being easy to use, are totally data-unaware to ensure optimal performance.
- Override Data Points Limit. To ensure optimal performance, some graphs have been working with a fixed Data Points Limit. If necessary, you can now override this limit.
- Canvas alignment. The page/canvas on which you design a dashboard can now be aligned Top, Bottom, Left, Right and Center.
- Trigger Improvements. New trigger categories. Elevate object criteria to Global criteria. Export current document. Export specific Layout.
- User Dimensions as criteria. Build your global or local criteria from User Dimensions via the Criteria Editor.
- Improved Dynamic content. Better options for displaying the actual criteria currently affecting your data.
- System Variable for Iteration Member. E.g., in iterated reports, the new system variable will be useful for creating section headers.
- Parametric Roles.
- InMemory improvements.
- Relational Model improvements.
| Anchor |
|---|
| TARGIT Insights |
|---|
| TARGIT Insights |
|---|
|
TARGIT Insights
TARGIT Insights is a new add-on product that comes with the TARGIT 2021 version. TARGIT Insights will provide valuable information about the use and current state of your TARGIT solution.
Once you enable TARGIT Insights, you will get this out-of-the-box:
- A cloud-based logging database.
- A comprehensive Data Model that connects automatically to your TARGIT Server.
- More than 30 pre-defined dashboards with relevant statistics about your TARGIT solution.
Some of the dashboard highlights are:
- User behavior - active an inactive.
- Documents and Data usage.
- Documents and Data not being used.
- Scheduled jobs statistics.
- Broken links overview.
See detailed TARGIT Insights documentation here: TARGIT Insights Documentation
The main dashboard of TARGIT Insights with links to all the other detail dashboards:
| HTML |
|---|
<div style="margin-left: 30.0px">
<iframe src="https://player.vimeo.com/video/470964004?loop=1" noborder="0" width="640" height="400" allow="fullscreen" scrolling="yes" seamless></iframe>
</div> |
TARGIT Insights, once you have obtained the license for it, is easily activated as a cloud service:
| HTML |
|---|
<div style="margin-left: 30.0px">
<iframe src="https://player.vimeo.com/video/470973914?loop=1" noborder="0" width="640" height="400" allow="fullscreen" scrolling="yes" seamless></iframe>
</div> |
| Anchor |
|---|
| New Map Offering |
|---|
| New Map Offering |
|---|
|
New Map Offering
The Map object has now been consolidated into a single object type. Previously, maps could be one of at least three different object types.
Furthermore, the TARGIT 2021 version of maps now offers a range of new features, highly requested by end-users:
- Point location by Longitude and Latitude
- Heatmap
- Auto-mapping of new members
If your data contain longitude and latitude information, you can choose the Longitude/Latitude mapping type from the Locations tab in the Map properties dialog.
All members with longitude and latitude information will then be mapped.
New members with longitude and latitude information that are subsequently added to your data set, will automatically be mapped without further user interaction.
| HTML |
|---|
<div style="margin-left: 30.0px">
<iframe src="https://player.vimeo.com/video/472100656?loop=1" noborder="0" width="640" height="400" allow="fullscreen" scrolling="yes" seamless></iframe>
</div> |
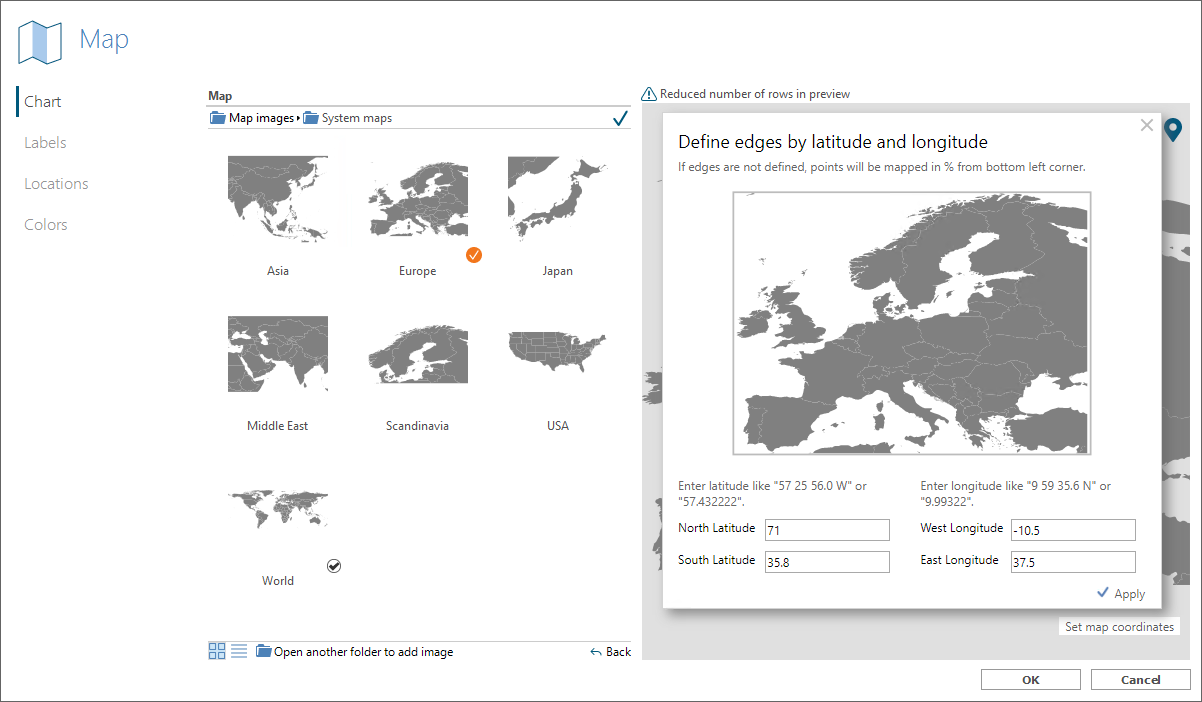
Please note that in order for Longitude/Latitude mapping to work correctly on custom maps, the projection type of these maps must be the 'equirectangular projection' mode.
Furthermore, the edges of the maps must be defined with regard to longitude and latitude information. These coordinates are set when adding/changing the map image.
The other mapping type is called 'Area mapping'. This option can be used if your map image is an SVG image with well-defined areas.
As part of the Area mapping dialog you select the dimension, e.g. Country, that you would like to map to a specific entry in your SVG image, e.g. area ID.
If new members are added to your data set, or if new areas are defined in the SVG image, these will automatically be mapped without further user interaction.
You can even create a combination of Point maps and Area maps:
| HTML |
|---|
<div style="margin-left: 30.0px">
<iframe src="https://player.vimeo.com/video/472100637?loop=1" noborder="0" width="640" height="400" allow="fullscreen" scrolling="yes" seamless></iframe>
</div> |
Turn your point maps into Heatmaps. From the Color tab in the Maps properties dialog, you can select the Heatmap option and work with a few settings:
- Max value. Sets the maximum value of your measure that will result in the most intense color as defined by your color gradient.
- Radius. The radius, in pixels, of an individual heatmap point.
- Opacity. Enter a value between 0 and 1. E.g., a value of 0.5 means 50% opacity which would make it easier to see the background image through the heatmap points.
- Color gradient. Lets you select from a list of pre-defined color gradients - or you can define your own custom gradient.
The top/left color is used at the edge of the heatmap point, while the bottom/right color is used at the center of the heatmap point.
| HTML |
|---|
<div style="margin-left: 30.0px">
<iframe src="https://player.vimeo.com/video/472100686?loop=1" noborder="0" width="640" height="400" allow="fullscreen" scrolling="yes" seamless></iframe>
</div> |
| Anchor |
|---|
| Dynamic Static periods criteria |
|---|
| Dynamic Static periods criteria |
|---|
|
Dynamic/Static periods criteria
Text:End-users will now be able to freely select from either Static options or Dynamic options when working with Time dimensions in the Criteria bar.
As a Designer user, you can control if a Time dimension in the Criteria should work only in a static way or only in a dynamic way, or if both options should be available to the end-user.
| HTML |
|---|
<div style="margin-left: 30.0px">
<iframe src="https://player.vimeo.com/video/472100386?loop=1" noborder="0" width="640" height="400" allow="fullscreen" scrolling="yes" seamless></iframe>
</div> |
| Anchor |
|---|
| Dynamic Hours and Minutes |
|---|
| Dynamic Hours and Minutes |
|---|
|
Dynamic Hours and Minutes
Text:
Hide objects
Text:
| Anchor |
|---|
| Disable Object Interaction |
|---|
| Disable Object Interaction |
|---|
|
Disable Object Interaction
Text:
| Anchor |
|---|
| Label Shape and Image objects |
|---|
| Label Shape and Image objects |
|---|
|
Label, Shape and Image objects
Text:
| Anchor |
|---|
| Override Data Points Limit |
|---|
| Override Data Points Limit |
|---|
|
Override Data Points Limit
Text:
| Anchor |
|---|
| Canvas Alignment |
|---|
| Canvas Alignment |
|---|
|
Canvas Alignment
Text:
| Anchor |
|---|
| Trigger improvements |
|---|
| Trigger improvements |
|---|
|
Trigger improvements
Text:
| Anchor |
|---|
| User Dimensions as criteria |
|---|
| User Dimensions as criteria |
|---|
|
User Dimensions as criteria
Text:
| Anchor |
|---|
| Improved Dynamic Content |
|---|
| Improved Dynamic Content |
|---|
|
Improved Dynamic Content
Text:
| Anchor |
|---|
| System variable for Iteration member |
|---|
| System variable for Iteration member |
|---|
|
System variable for Iteration member
Text:
| Anchor |
|---|
| Parametric Roles |
|---|
| Parametric Roles |
|---|
|
Parametric Roles
Text:
| Anchor |
|---|
| InMemory improvements |
|---|
| InMemory improvements |
|---|
|
InMemory improvements
Text:
| Anchor |
|---|
| Relational Model improvements |
|---|
| Relational Model improvements |
|---|
|
Relational Model improvements
Text:
| HTML |
|---|
<style type="text/css">
#title-text { display: none;}
#breadcrumbs, #footer, #likes-and-labels-container, #comments-section { display:none; }

div.theme-default .ia-splitter #main {
margin-left: 0px;
}
.ia-fixed-sidebar, .ia-splitter-left {
display: none;
}
div#main {
margin-left: 0px !important;
}
div#footer {
margin-left: 0px !important;
}

.columnLayout.two-equal
{
padding-left: 20px;
padding-right: 20px
}

#main #content
{
padding-right:0px;
}

div#main
{
padding:0px;
}
#page
{
overflow-x: hidden;
}
iframe#topheader
{
border:0px;
}
.contentLayout2 .columnLayout
{
margin-bottom:0px;
}

#workflow-page-message
{
margin-bottom: 0px;
}


.columnLayout.two-equal
{
width: 85%;
margin: auto;
}
</style>

<script src="//cep.targit.com/bundle/beacon"></script>
<iframe id="bottomfooter" src="https://www.targit.com/emptyfooter" scrolling="no" frameborder="0" style="width:100%;height:190px;overflow:hidden;scrolling:no;border:0px"></iframe>
|
 Back
Back